AppliedXL Achieves State-of-the-Art Clinical Trial Prediction With Domain-Specific Agentic AI
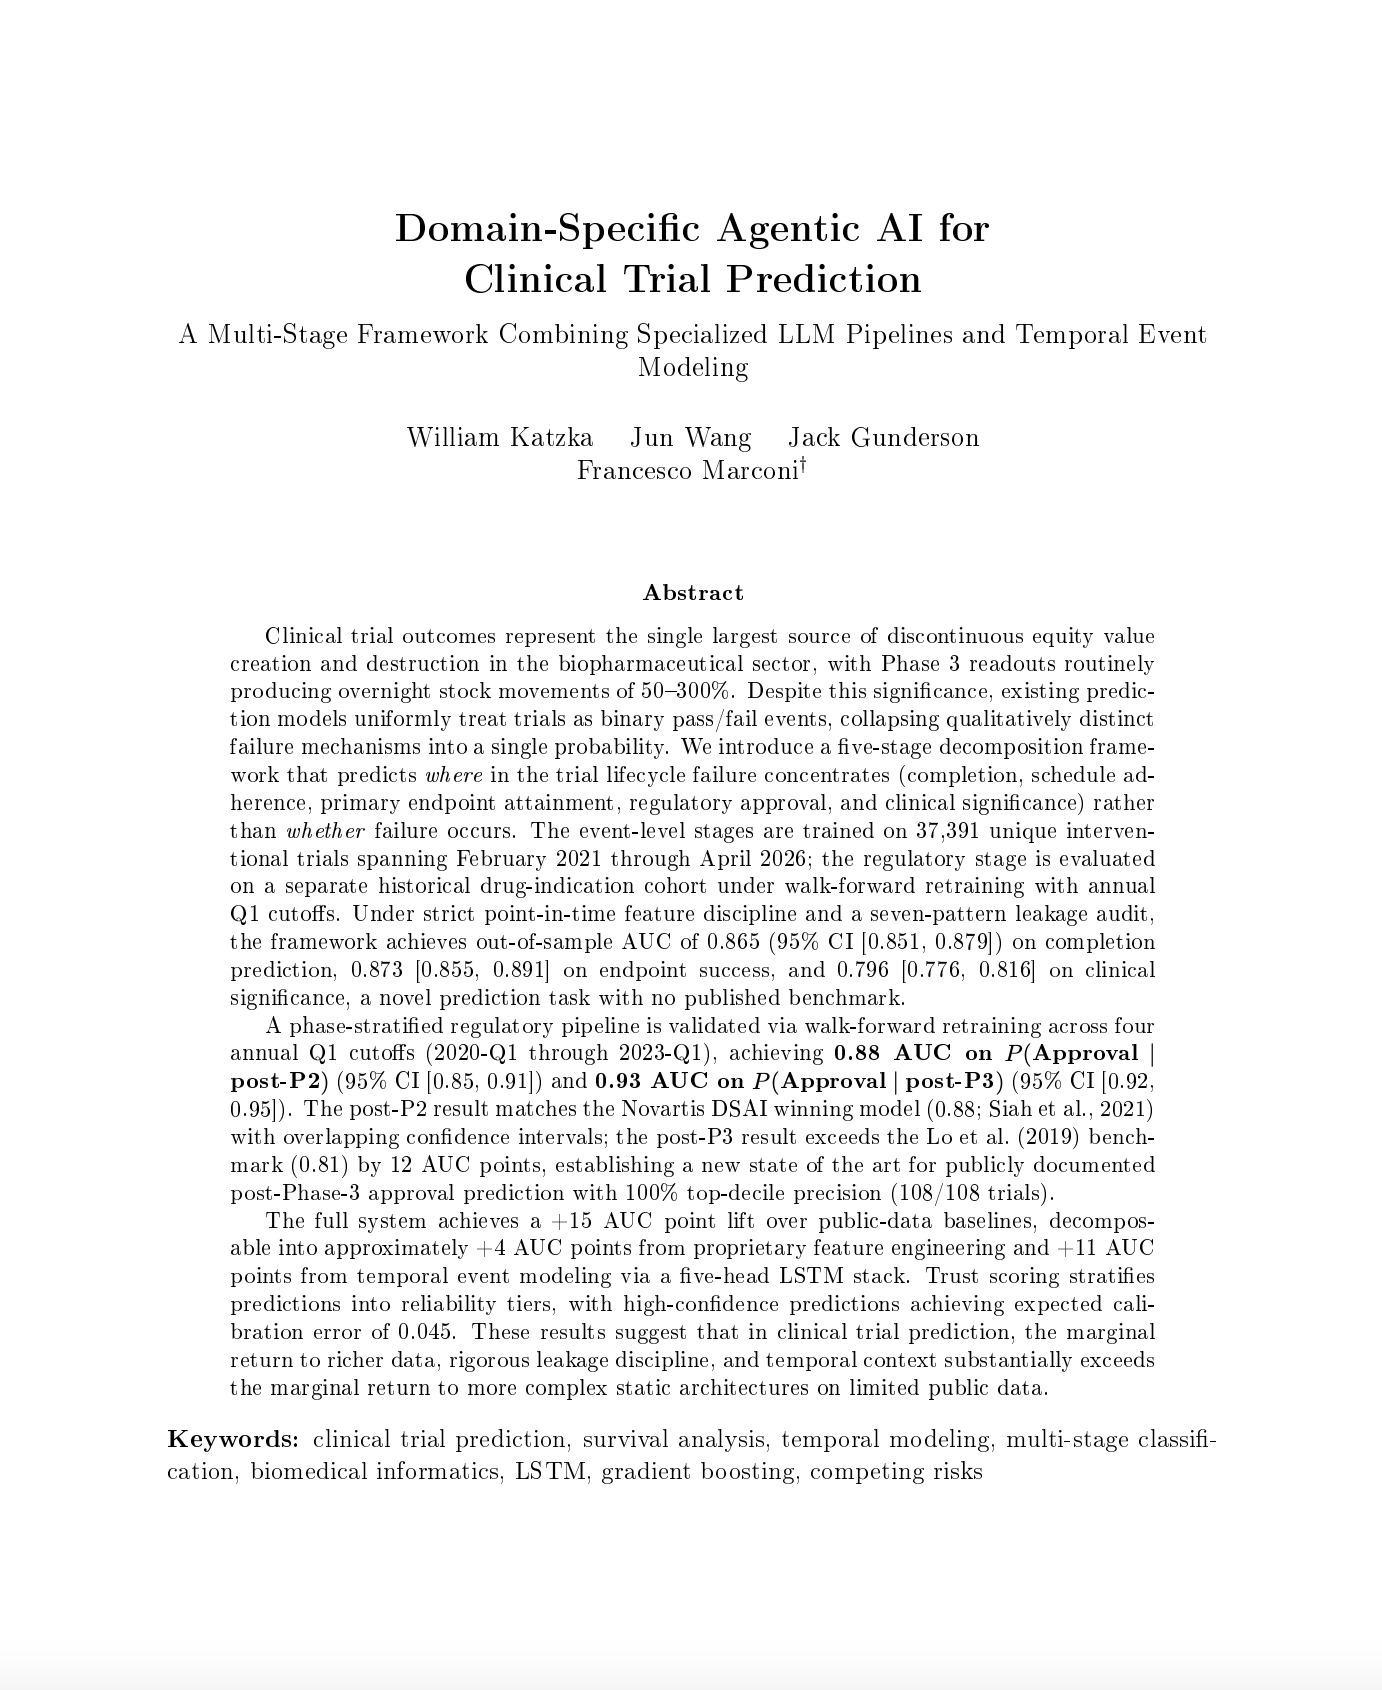
Clinical trials don't just succeed or fail. They pass through five sequential checkpoints, and failure can concentrate at any one of them. Our new paper presents a framework that predicts where in that sequence a trial is most likely to fail, achieving 0.873 AUC on endpoint prediction — 17 points above the best published baseline.
Key Takeaways
- 0.873 AUC on endpoint prediction — 17 points above the best published baseline
- Five-stage conditional decomposition: completion, schedule, endpoint, regulatory, clinical significance
- Only 12% of trials clear all five checkpoints
- 280 biological and operational signals reconstructible at any historical date
- +11 AUC points attributable to the temporal LSTM architecture alone
Every published model in clinical trial prediction asks the same question: will this trial succeed or fail? The framing is intuitive, but it discards information that matters. A trial terminated for enrollment failure is a different event than one that meets its endpoint with an underwhelming effect size. Investors price these differently. Models that don't distinguish them have plateaued in the 0.65 to 0.70 AUC range across the literature.
Our framework decomposes the trial lifecycle into five conditional stages: completion, schedule adherence, endpoint attainment, regulatory approval, and clinical significance. Each stage carries a distinct dominant failure mechanism and requires a different feature set to predict. Only 12 percent of trials clear all five.
Architecture
The architecture has three components. A domain-specific LLM extraction pipeline reads a five-year corpus of biotech press releases to construct outcome labels with confidence scoring and human validation. A point-in-time feature layer assembles 275 biological and operational signals reconstructible at any historical date. A five-head temporal LSTM rescores predictions at every public trial announcement.
Benchmarks
All comparators evaluated on the endpoint prediction task under their original stratified cross-validation protocol.
The 17-point gap exceeds the entire spread between published baselines. Controlled ablation attributes +4 AUC points to richer features (algorithm held fixed) and +11 AUC points to the temporal LSTM. Each contribution alone would beat the prior state of the art.
Temporal Validation
Performance under walk-forward retraining across quarterly cutoffs: 0.91 on regulatory approval (cohort-weighted across phases), exceeding every published benchmark including Novartis DSAI winner (0.88) and Lo et al. 2019 (0.78 P2, 0.81 P3); 0.865 on completion; 0.816 on endpoint; and 0.796 on clinical significance — a task with no published comparator. Trust-tiered predictions reach expected calibration error of 0.045 in the high-confidence band.
FULL PAPER
Read the full paper